Supporting
Business Intelligence Capabilities
Users & Context
DATA ANALYSTS
Our core and the primary user is the Data Analyst. Well versed in data, this role often knows business intelligence and analytics tools. They use SQL, Python & R languages for data analysis.
Citizen Analysts/Business Analysts
Our secondary persona for the tool, are domain experts. They lack the technical ability to query data and conform to tools such as Microsoft Excel and use the drag & drop methods of analysis.
The Business Analysts leverage Business Intelligence (BI) Analytics to answer their day-to-day business questions.
They leverage their analytical mindset and knowledge of the data to build out reports for their teams to make data-driven decisions.
They have no exposure to querying languages such as SQL and popularly use Excel to perform analysis.
They build dashboards and one-off charts to monitor team KPI performance by individual and to answer ad-hoc questions.
Our tool was not equipped to serve these Business Analysts as there was no easy or convenient way for them to engage with the available data in a meaningful way.
They request the Data Analysts within their organization to build dashboards and answer ad-hoc questions.
Problem
Analytics powered by data analysts does not scale.
Companies with a larger than 50:1 ratio of data consumers to data analysts see their analytics practices break down, including:
long lag times for requests to be fulfilled.
only top requests get fulfilled, everything goes into the backlog black hole
analyst turnover increases due to lack of time digging into deeper problems
Companies with strong reporting needs but with a high data consumer to data professionals ratio have data teams that get overwhelmed with the sheer volume of ad-hoc and description analysis requests.
Companies that do not have this problem have set up a system in which teams get prepared data regularly, and leverage drag and drop tools on top of them.
Solution
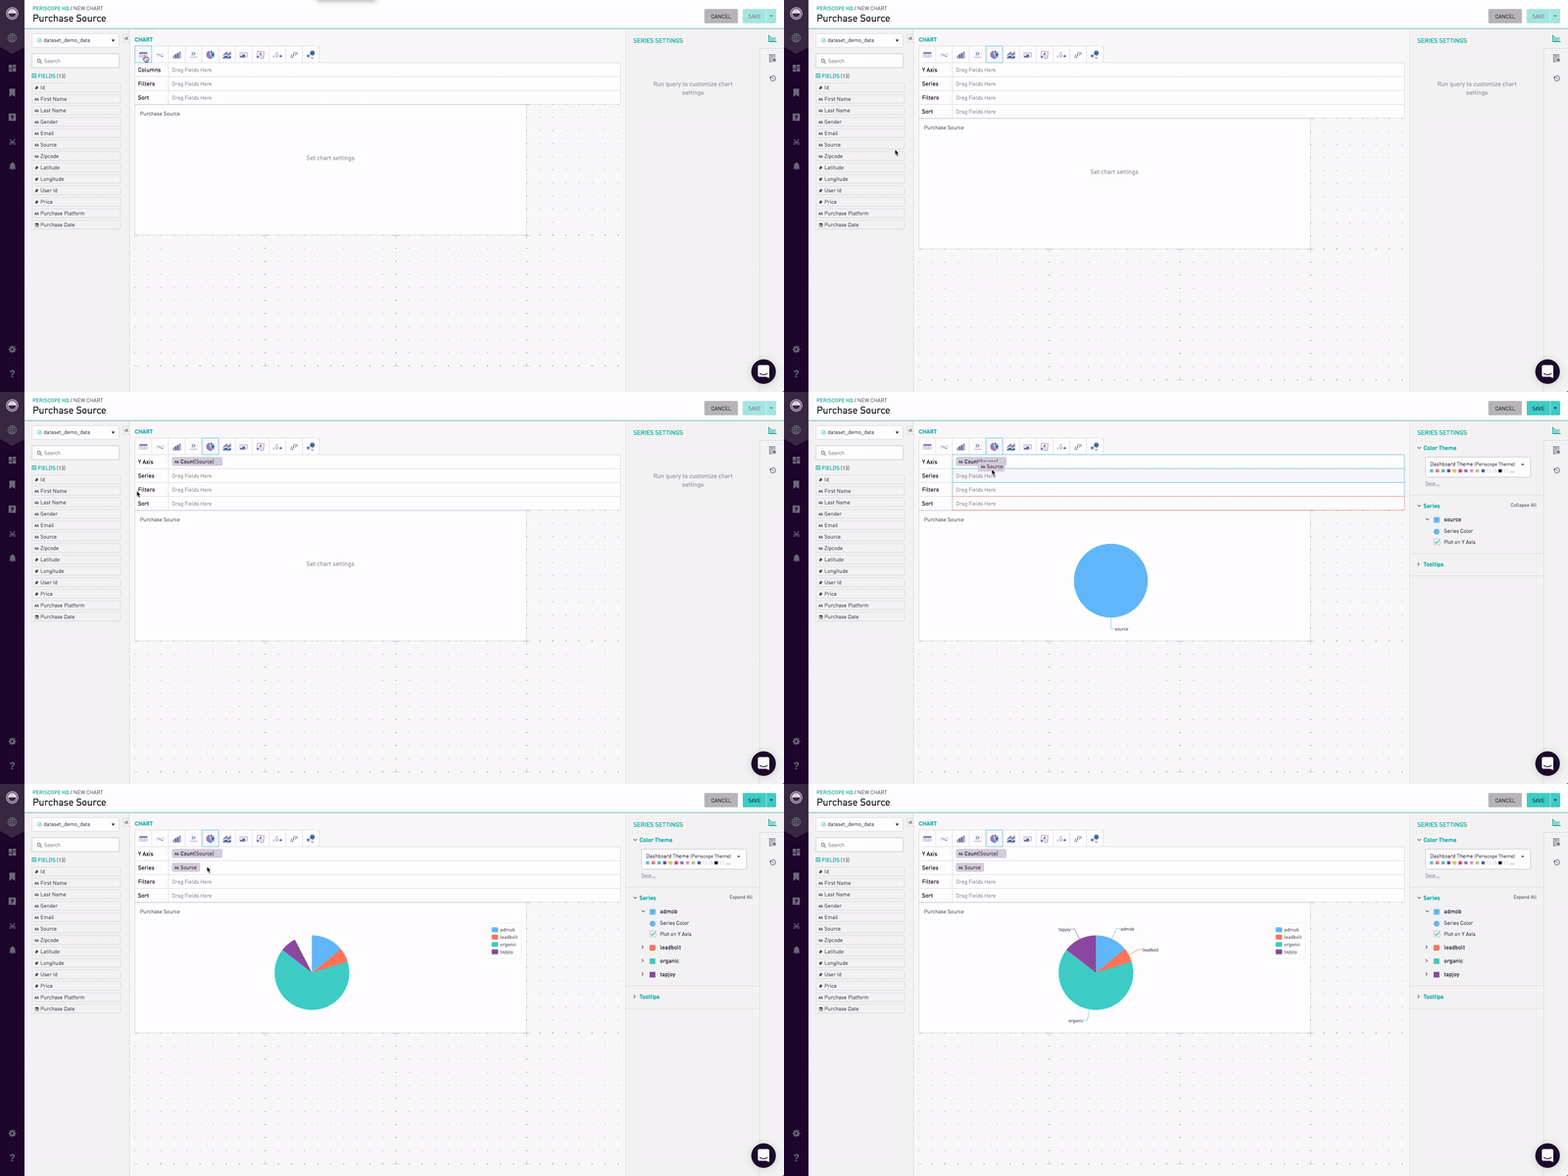
Introduce a Drag & Drop data (DnD) querying feature for the Business Analysts in the tool that will help capture the data consumer market and bring them to our tool.
At the same time, enable data teams to support business analysts, managers, and operations teams by providing just-in-time data models that are owned and backed by data analysts.
The solution aimed at supporting close collaboration between the DnD creators and Data Analysts, allowing the data team to provide stable models where they exist, and iterate quickly on new models.
Role
My role was to mentor the junior designer, who tackled all the detailed designs on the project. I was responsible for the design strategy. As a design team of two, we partnered with our PM for research and testing.
Design kickoff was in April 2018. We shipped a fully functional feature in Sept 2018.
UI Strategy
An intuitive, drag-and-drop interface that Business Users can use to analyze data and create visualizations to discover actionable insights. With the help of the tool, they should be able to start exploring data and creating charts immediately, and answer critical business questions change.
Design Principles
The interface contained a single drag and drop element that was the ‘Pill.’ All the principles defined below are for this element.
Surface visual affordance
The pills that can be displaced should indicate the tangibility even without any external interaction.
Drag and drop targets
Users should be able to understand the interactions involved in dragging and dropping the pills effortlessly. This includes the change in cursor when the mouse is on top of the draggable element and when the pill is dropped to the target area and so on.
Status styles
The pills should indicate the status of the operation to perform. Status includes normal, inactive, error.
Supporting functionalities
The visual language should extend such that the pill can incorporate the supporting features.
Result
This feature became hugely popular amongst the data consumer and BI Analysts roles. We could extend our reach to a much wider audience such that Business users could see the value Periscope brought to them. It has also contributed to closing strategic deals where the business analysts made the buying decisions.


