Sangeeta

Hello.

I’m Sangeeta.

I’m a digital product designer focused on SaaS products. I currently lead design for a data analytics platform at Periscope Data.    

I define product through the entire design lifecycle - from system design, research to design explorations, wireframes & prototypes.

I live in San Francisco Bay Area.


Banner -4.png

Periscope Data

2016 - Present

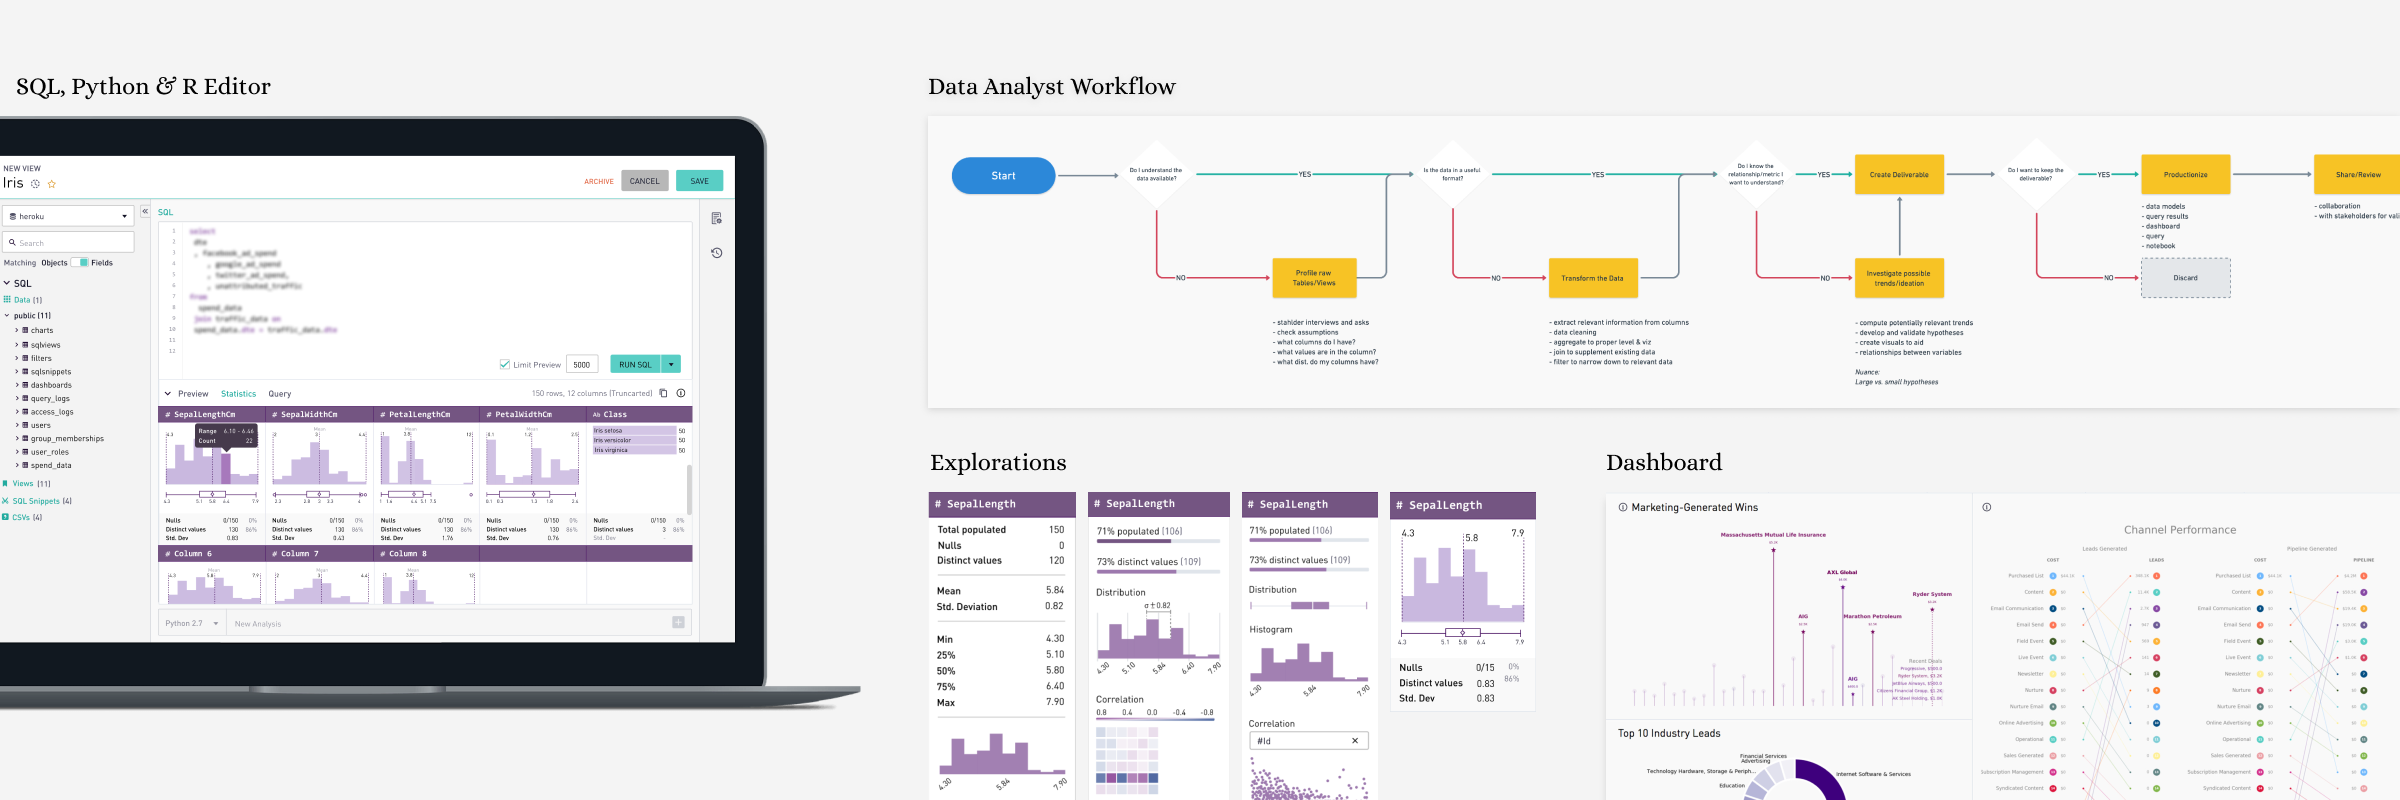
Periscope Data is a platform that assists end-to-end data analytics workflow using SQL, Python & R languages for the data teams. 

I led the effort of overhauling the product design & workflows. Scope of responsibilities ranged from research, interaction and visual design to prototyping - for all parts of the product. Since then, I have led design engagements for all the significant features, established processes and mentored junior designers and junior PM’s in the team.


PD-0.png


Product Redesign 2016

When I joined the organization in 2016, the product capabilities were at its infancy. There was a dire need to overhaul the tool to set up the product for future expansion. I led the effort of a redesign of the product. The goal was to ensure that all of our core workflows remain intact. We also took this opportunity to revise and introduce flows critical to user tasks.

Highlights of the process include, 

  • Design strategy to serve two diverse sets of highly technical user groups, Data Analysts & Business Analysts.

  • Discovery research with our then 300+ customers. 

  • Cross-functional team collaboration with the engineers. 

  • Oversee the design development of the entire product offering.

  • Laid the foundation for design systems and component library.

Case Study


Crafting Data Analysis Experiences

Our primary user is the Data Analyst. Well versed in data, this role is often a master at business intelligence and analytics tools and applies analytics to analyze various aspects of the business. 

The data analysis workflow is core to the product. For the last couple of years, my primary focus has been to define and maintain the design of seamless end-to-end analytics experience.

Highlights of the features I worked on include,

  • Querying SQL to get charts - our most crucial workflow

  • Modelling in Python or R, then visualizing and reporting results

  • Enabling advanced analytics capabilities in the tools ex. Summary Statistics

Data Analyst workflow improvement is an ongoing initiative for us. I meet and conduct design sprints with our in-house data team and other SME’s at regular intervals to make the product superior in technology and experience.

Case Study


Information Organization for Scale

Our data analytics platform supports organic content creation ex. Dashboards and charts that are generated every day by users; as well as structured content like datasets built and managed over time by content owners in various departments.

Over time, our maturing customers with larger deployments started facing trouble managing and auditing the content. To address this problem, we wanted to build better information organization capabilities into the product.

The goal was to implement building block technologies rather than end-to-end workflows to organize content. Challenges involved were in establishing the strategy for information architecture & information consumption structure such as Tags or Folders.

Areas of focus included

  • Landing Pages

  • Navigation & Search

  • Content & Object Organization

  • Lifecycle Management.

Case Study


Supporting Business Intelligence Capabilities

Our secondary persona for the tool is the citizen analyst. Citizen analysts are primarily subject-matter experts in a specific area of business, e.g., a business analyst focused on risk or fraud, a marketing analyst aiming to build out new offers. 

Last year, we built a custom analysis feature for the less technical user base. This offering leverages the use of an intuitive, drag-and-drop interface, that business users could analyze data and create visualizations to discover actionable insights. 

The aim of the tool was for business users to start exploring data and creating charts immediately, and answer critical business questions change.

Case Study


Past Work

2011 - 2016

Globant Technologies is a design-led development services company, that uses the latest technologies in the digital field to empower organizations in every aspect. 

My team was responsible for crafting usable experiences for a range of products across various domains such as healthcare, finance, logistics and other large enterprise industries. We employed extensive user research and other traditional UX design processes to deliver high-quality solutions to all our clients.


Accounts 1.png
 

Account Management Tool

A CRM tool to transform the way accounts are managed, grown & harvested across the organization. The tool helped sales to efficiently manage their account by monitoring the associated resources and tracking its overall progress.

 
Solver.png
 

Enterprise Social Network

A leading provider of complete BI solutions for the mid-market enterprise. The product offers a powerful and intuitive suite of modules for reporting, budgeting, dashboards, and data warehousing.

 
Data Science.png
 

Data Science Platform

An analytics service to support the growing need for analytics expertise in the life sciences and the professional services industries. The solution enabled customers to make smarter business decisions by using the predictive wisdom of a community of analytics experts, data scientists & consultants to deployable predictive analytics and data mining solutions.

 
Fleet 2.png
 

Fleet & Asset Management

Design for a high-scale, high-performance enterprise system, an application used in heavy earthmoving and excavation industry using ‘Telematic’ devices. The objective of the product re-design was to improve business efficiency and bring in seamless coordination in local site operations. 

 
Census 2.png
 

India Census Report, 2011

The Census 2011 was the 15th National Census survey conducted by the Census Organization of India. This report was created for Census of India 2011 in collaboration with the Office of Registrar General of India, Delhi and National Institute of Design, India.

The book's design presents this information in an accessible, narrative sequence, creating a valuable resource for planners, policy-makers & politicians invested in the countries' future.


Want to work together?
You can connect with me on LinkedIn or feel free to drop me an email.